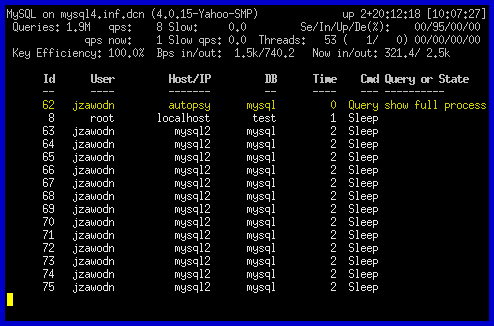
Mytop is an open source, command line tool used for monitoring MySQL performance. Mytop program provides a command-line shell interface to monitor real time MySQL/MariaDB threads, queries per second, process list and performance of databases and gives a idea for the database administrator to better optimize the server to handle heavy load.
To install Mytop, we should make sure that the installation is going to be at the same server where the MariaDB database server is installed. Then we add the EPEL repository, as follows:
# yum install epel-release
As we have updated the EPEL repository on the server, Now we can install the mytop package using the EPEL repository with the below command.
# yum install mytop –y
Configuring the Mytop Package on CentOS 7
We have to configure the mytop using the customized file .mytop to create the configuration file, run the below command, add the configuration given below:
# vi ~/.mytop

host=localhost
db=mysql
delay=3
port=3306
socket=
batchmode=0
color=1
idle=2
Once done, you can check the MySQL processes real time using below command:
# mytop
Shortcut Keys for mytop Command
The following keys performs various actions while mytop is running:
? Display help.
c Show "command counters" based on the Com_* values in SHOW GLOBAL STATUS. This is a new feature.
Feedback welcome.
d Show only threads connected to a particular database.
f Given a thread id, display the entire query that thread was (and still may be) running.
F Disable all filtering (host, user, and db).
h Only show queries from a particular host.
H Toggle the header display. You can also specify either "header=0" or "header=1" in your config file to
set the default behavior.
i Toggle the display of idle (sleeping) threads. If sleeping threads are filtered, the default sorting
order is reversed so that the longest running queries appear at the top of the list.
I Switch to InnoDB Status mode. The output of "SHOW INNODB STATUS" will be displayed every cycle. In a
future version, this may actually summarize that data rather than producing raw output.
k Kill a thread.
m Toggle modes. Currently this switches from `top' mode to `qps' (Queries Per Second Mode). In this mode,
mytop will write out one integer per second. The number written reflects the number of queries executed
by the server in the previous one second interval.
More modes may be added in the future.
o Reverse the default sort order.
p Pause display.
q Quit mytop
r Reset the server's status counters via a FLUSH STATUS command.
s Change the sleep time (number of seconds between display refreshes).
u Show only threads owned by a giver user.
